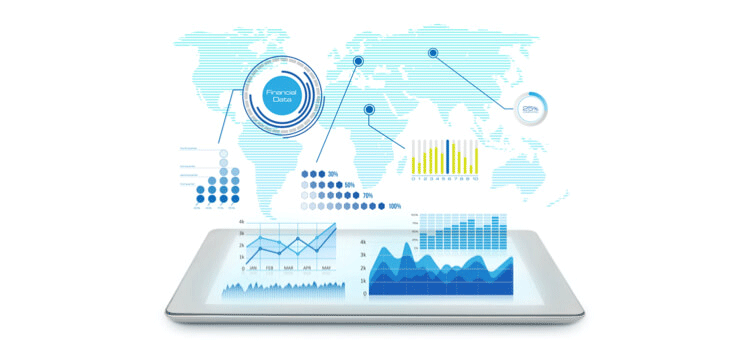
The Graphic representation of information and data constitutes Data Visualization. It is the representation or conversion of large datasets into visual graphics. This helps in easy understanding of the insights and complex relationships within a dataset. Trends, patterns, and outliers in a dataset are easy to comprehend with Data Visualization.
Visual elements like Graphs, Charts, and Maps are used for the graphical representation of data.
Data Visualization holds a significant position in the world of Big Data. It helps in analyzing large sets of data. This leads to help in making informed decisions.
World Economic Forum states that the world produces 2.5 quintillion bytes of data every day. The digital world is expected to reach 44 zettabytes this year and by 2025 it is estimated that 463 exabytes of data will be generated each day worldwide.
It is the era of Big Data and this Big Data vertical is experiencing exceptional growth. Visualization comes into play and makes it humanly possible to make sense of massive amounts of data produced every day. Data Visualization graphically tells the story based on data insight and highlights the trends and outliers. It narrows it down to only useful information.
Common and generic types of data visualization are Charts, Tables, Graphs, Maps, Infographics, and Dashboards.
Data Visualization is more of data storytelling.
Benefits Of Data Visualization
1. Speed
The processing of visual information is easier and faster. Complex data gets translated into graphs and charts and clutter is eliminated. It enables businesses to see clear information and can limit the time that gets spent on making decisions. This makes it easy for business leaders to decide quickly and move forward in competitive markets.
2. Coping With Ever-Changing Market Trends
Market trends are ever-changing and in today’s markets which are technology-driven, it is important for businesses to analyze the consumer behavior data. Market shifts can easily be spotted by using big data visualization techniques. Data Visualization helps businesses stay aware of rapidly changing trends. This helps businesses to make informed decisions and one stay at top of its competition.
3. Identifying Relationship between Operational Data & Results
Operational Data visualization makes it possible to utilize the operational data in an effective way. It can easily show the relationship between operations and results. Business Managers or decision-makers can easily and quickly grasp the complex relationship between operations and respective results. For example; if sales are down in one region and high in the other region, managers can read through the situation quickly and can make quick real-time decisions to improve the situation.
4. Ease of Decision Making
Big Data field has gained much popularity and businesses are collecting and storing big data sets. This data on its own is of no value until it is set for analysis. Once this data is compiled and transformed into Reports format, it still requires a lot of work to go through the Reports and make some sense out of it. Data Visualization eases for business decision-makers to understand large sets of data through graphs, charts, and different easy to comprehend formats.
5. Valuable Insights into Healthcare
Visual Analytics can provide valuable insights to healthcare organizations. Data visualization in healthcare helps to identify patterns and correlations and makes data analysis more efficient.
Visual Discovery Vs Traditional BI
The Analyst Insight by Aberdeen Group defines two different styles of BI as follows;
Traditional BI
Traditional BI - Also referred to as managed reporting. Although business managers are often involved, this style of BI is predominantly controlled, driven, and delivered by corporate IT. In many cases, only static views of data are available, and any changes or enhancements must be made by the IT organization.
Visual Discovery
Visual Discovery - A rich, highly interactive, the visual tool is provided to business users to allow them to manipulate and explore information directly. Although corporate IT is still involved, a large part of the responsibility for creating and accessing different views of the data falls on the business community.
Visual Discovery users are gaining in number. The way management information is presented to the decision-makers is changing rapidly and shifting towards Visualization. This has increased the demand for visualization tools that are deployed for data visualization needs. Visual discovery provides timely access to information.
Data Visualization Tools
The 6 Best Data Visualization Tools Available Today;
Conclusion
Big Data is playing a vital role in business decisions and with this increasing demand for Big Data Analysis the need for Data Visualization is equally going up.
With information representation, businesses or other organizations can take advantage of the genuine capability of their information, and they can do this rapidly, productively, and viably. Thusly, this can prompt upgraded quality and speed of dynamic procedures, just as quantifiable increments in profitability and proficiency.
Please feel free to Contact us for your data needs in place.

